![[Ticker Pause]](/static/cdg_imgs/bt_ticker_pause.gif)
![[Ticker Play]](/static/cdg_imgs/bt_ticker_play.gif)


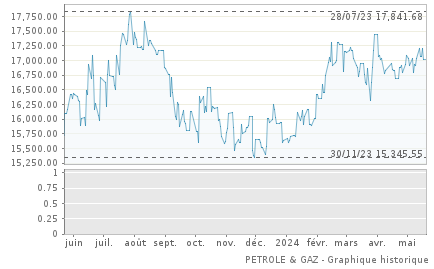
PETROLE & GAZ
Autorisé
(-)
- 19 241,38
- 0,00%
- [ 18/09/2025 08:03 ]
MA0000000081 - P&G
- [ Intraday | Historique ]
-
cotation [ 18/09/2025 ]
| PTO | - |
| PTC | - |
| Ouverture | 19 241,38 |
| + Haut | 19 241,38 |
| + Bas | 19 241,38 |
dernières sessions
| Date | Cours | Ouverture | + Haut | + Bas |
|---|---|---|---|---|
| 17/09/2025 | 19 241,38 | 19 241,38 | 19 241,38 | 19 241,38 |
| 16/09/2025 | 19 241,38 | 18 947,81 | 19 241,38 | 18 947,81 |
| 15/09/2025 | 18 947,81 | 19 466,88 | 19 466,88 | 18 947,81 |
| 12/09/2025 | 19 466,88 | 19 478,13 | 19 478,13 | 19 466,88 |
| 11/09/2025 | 19 478,13 | 19 483,53 | 19 483,53 | 19 478,13 |
indicateurs de marché
| Période | + Haut | Date | + Bas | Date | Variation |
|---|---|---|---|---|---|
| 1 semaine | 19 483,53 | 11/09/2025 | 18 947,81 | 15/09/2025 | -1,24 |
| 1 mois | 19 624,80 | 27/08/2025 | 18 888,90 | 09/09/2025 | -1,16 |
| 3 mois | 19 624,80 | 27/08/2025 | 18 571,19 | 04/07/2025 | 0,27 |
| 6 mois | 19 782,78 | 11/06/2025 | 17 580,21 | 09/04/2025 | 3,79 |
| 1 an | 19 870,26 | 21/02/2025 | 16 386,16 | 18/09/2024 | 17,42 |
| YTD | 19 870,26 | 21/02/2025 | 16 442,79 | 02/01/2025 | 17,02 |
| 3 ans | 20 057,51 | 20/09/2022 | 15 345,55 | 30/11/2023 | -2,94 |
| 5 ans | 23 639,05 | 10/02/2022 | 12 866,92 | 29/09/2020 | 49,01 |
plus fortes hausses
| Libellé | Cours | Var.(%) |
|---|---|---|
| TOTALENERGIES MARKETING MAROC | 1 765,00 | 3,22 |
plus fortes baisses
| Libellé | Cours | Var.(%) |
|---|---|---|
| AFRIQUIA GAZ | 4 440,00 | -0,43 |
CARNET D'ORDRES
refresh
| Ordres | Titres | Achat | Vente | Titres | Ordres |
|---|
Aucun résultat à afficher.
Download
Download

![toutesActus=[ Toutes les actus ]](/static/cdg_imgs/bt_all_news.png)
![[ Flux RSS ]](/static/cdg_imgs/bt_rss.png)